

Hospital construction costs have surged at an unprecedented and extraordinary rate starting before the Covid pandemic. A recent analysis of 35 hospital projects suggests that many acute care facilities now cost owners three to six times what inflation justifies. The data shows that the problem is not primarily building materials or direct labor, but in the non-value-added scopes and overhead. The data also shows a strong correlation between the concentration of the highest cost escalation and the expansion of cost and effort-based contracting frameworks. This article describes the phenomena, pinpoints its causes, and suggests a value-aligned contracting framework that will promote automation, cut waste, and enhance quality and cost outcomes.
According to nationally released macroeconomic data1,2, construction costs increased to double their inflation-adjusted value in 2025. A separate microeconomic study of the 35 hospitals, suggests that many now cost owners more than three times. And even more extreme cases are found in California, where the cost will surpass five times what inflation accounts for on many projects. And there is no apparent end in sight. The national economy is at risk from this, and it needs to end.
We can now objectively measure and compare cause-and-effect relationships thanks to a breakthrough in MVA (multivariate analysis). We are no longer constrained to comparing or benchmarking complex projects at the simple total cost per total GSF without any other context than the building type, gross area, city, and year. This is essential to measuring value and process improvement.
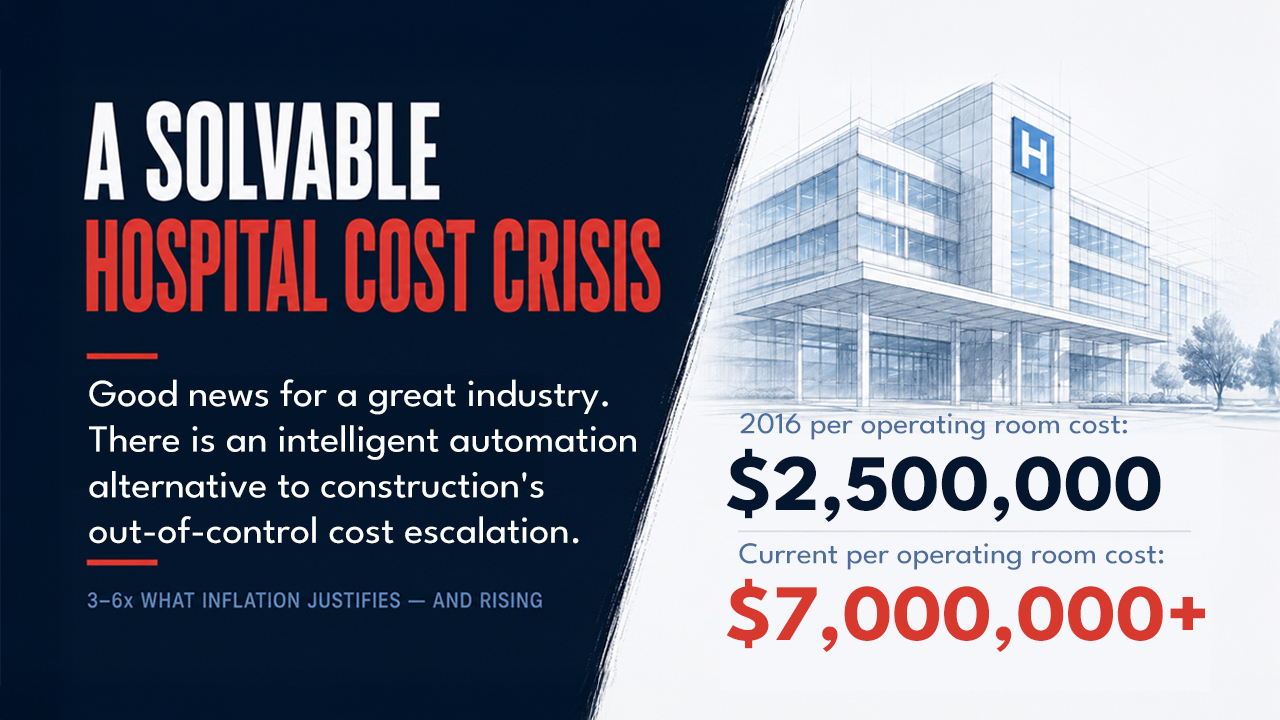
Let’s consider the example of a hospital operating room. Based on national inflation, the construction cost for each OR should amount to about $2 million (including apportioned supporting spaces, core, shell, and site).
Based on Construction Analytics2 tracking of construction escalation, the same OR being planned today would be budgeted at roughly $4.4 million—more than double the inflation-adjusted value.The compounding circa-2018 surge however has resulted in that OR costing owners between $6 million and over $9 million (normalized to a mid-market like St.Louis) as depicted in Figure 1. Even worse, it could cost between $11 and $14 million if located in California.
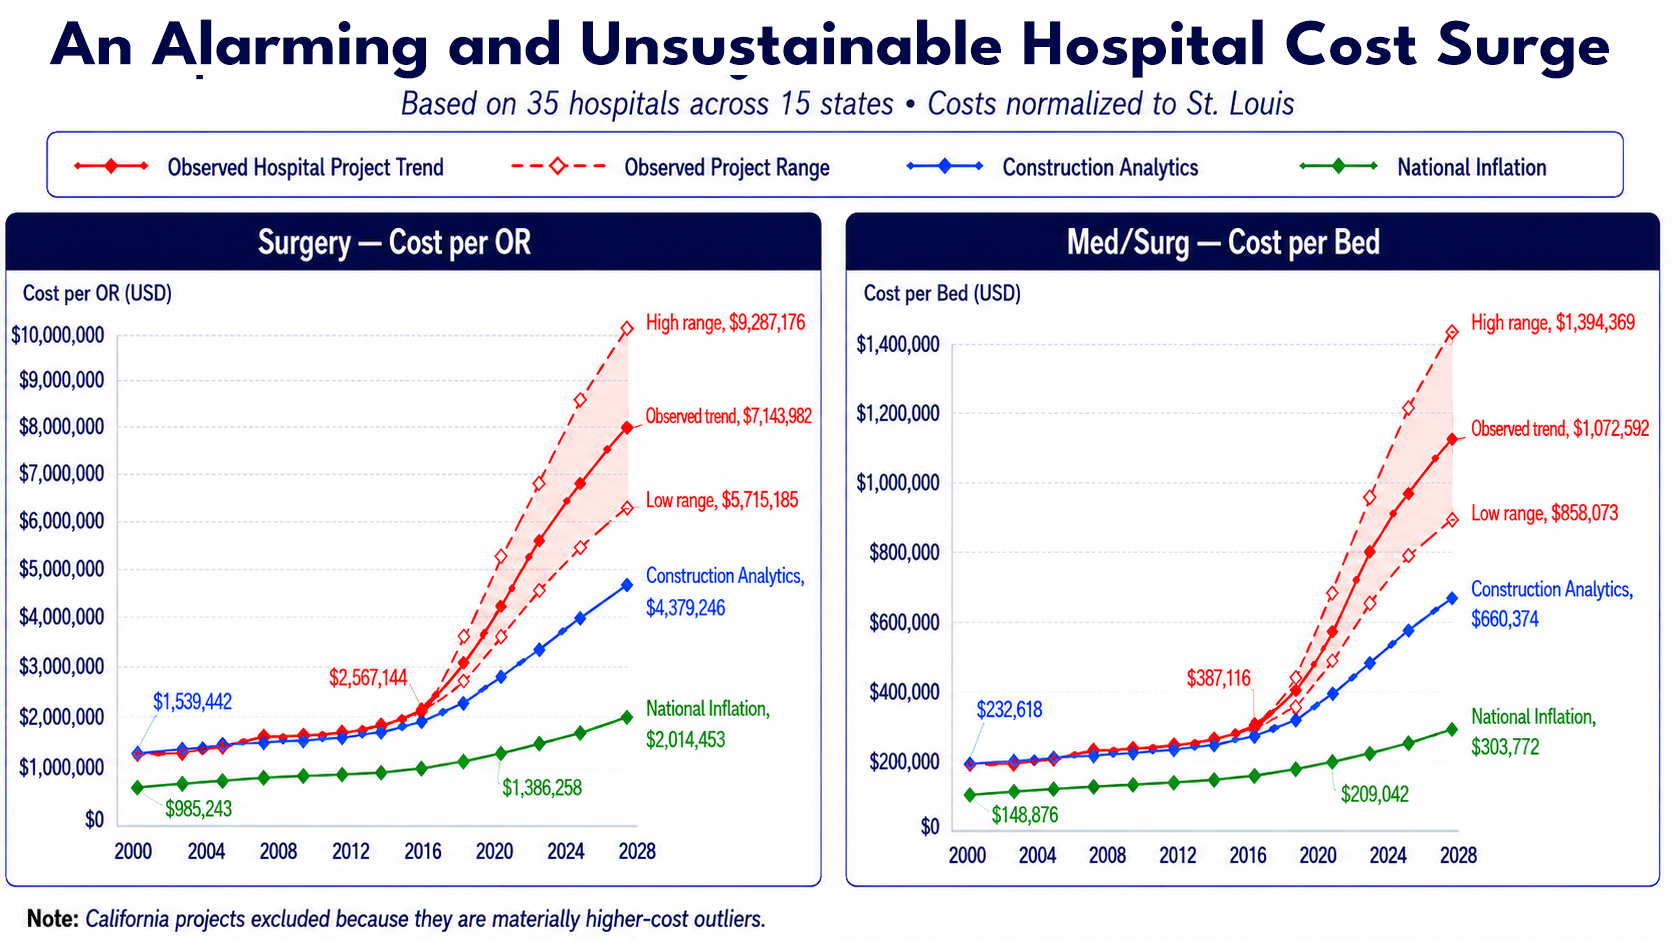
Construction of an OR, patient bed, exam room, imaging unit, or any of the many other functions will cost commercial, private, and public (tax) payers three to six times what inflation justifies in this startling, fragmentation-fueled economic phenomena.
The pandemic, the complex nature of construction today, or regulatory burdens cannot account for this phenomenon. It is a structural issue that is becoming worse. This data reveals how much hospital construction costs have decoupled from inflation in a way that has never been seen before. It comes from a thorough, micro-economic analysis of 35 hospital projects, spanning several regions, delivery models, and market tiers, with project data anonymized for confidentiality.
Surgery suites are running at roughly 3½ times their inflation-adjusted value. Medical/surgical patient beds are running approximately 3 times. The gap between these two figures is not random, and the data points to a specific structural explanation — one tied to how mechanical, electrical, and plumbing (MEP) trade contracts have evolved over the past two decades.
The instinctive explanations — labor shortages, supply chain disruption, more complex facilities, increased regulatory requirements, and risk aversion — are all real, but they also existed before 2018 and are already baked into the published escalation data. They do not, therefore, account for the scale of the divergence shown in Figure 1.
While the amount that health systems pay for hospitals has soared, building materials and construction wage rates have escalated only modestly above general inflation for decades1. A simple calculation shows the overwhelming increase in indirect labor, other overhead, and poor productivity. Unless an electrician pulls less wire per hour than his father did, the main problem is in non-value-added efforts and scopes of work. While most innovation strategies, like prefabrication, are aimed at the direct material and labor scope – the problem resides substantially in the indirect scope.
The core drivers or causes include fragmentation, lack of objective knowledge, and — albeit seldom emphasized — the prevailing compensation framework: cost-based contracts and billable-hour structures across the board. Under this model, the financial interests of every participant — owner advisor / representative, architect, engineer, builder, and trade contractor — are structurally aligned with higher costs, not lower ones. Fees are set as a percentage of the hard cost budget.
One of the main causes of the construction industry's predicament, according to McKinsey's groundbreaking 2017 research "Reinventing Construction, the Route to Higher Productivity," is misaligned incentives. In most cases, it is not the work of nefariously motivated, bad actors. It involves logical actors working within a flawed system with misaligned incentives, which is made worse by fragmentation and a lack of impartial market intelligence. The compensation and risk structure make it financially logical to shape the highest defensible budget, set fees accordingly, expend the maximum number of billable hours possible, and profit generating GR/GC equipment and other requirements. Large, technically challenging, and protracted hospital projects provide the perfect setting for these dynamics to intensify.
Since the 1970s, the proportion of negotiated project delivery (construction management at-risk and ensuing IPD and design-build methods) has grown steadily across most building types. Following decades of steady high construction escalation over inflation – a notable surge appears in around 2004 and again in 2018. Data research on these phenomena is definitely worth pursuing.
Given that this problem has compounded for decades, why haven’t influential health system owners and/or their advisors pushed back more effectively? One answer is partly that cost-plus models offer genuine risk protection — owners bear less schedule and scope risk on paper. But the data suggests they have been trading known, bounded risk for a much larger, less visible cost premiums baked into every budget from the start. The “safe” budget has, in practice, become the expensive one — now by multiples of the real value. Another answer is simply the lack of market knowledge by department (i.e., Radiology) and function (i.e., MRI vs. Ultrasound). Owner’s and their advisors – and even sophisticated cost experts – have lacked this level of market intelligence at the functional level.
The old axiom applies that we cannot improve what we can’t measure. Now that the cost per OR and the myriads of other functions (aka “the owners business case”) can be exposed and measured – the opportunity finally exists to improve same. What if, therefore, we could reverse this trend— say 10% per year on average? In the annual $2 trillion US construction market– that would be $200 billion available in the first year to reduce debt and infuse innovation to produce better, more durable, and sustainable buildings. Instead of excessive cost escalation, we’d enter an era of compounding waste removal and value improvement.
The scale of accumulated waste now makes a fundamental compensation model shift not just desirable, but financially compelling for a coalition of health systems and other influencers willing to lead — preferably with advisors, architects, and builders who agree that it is time to make a significant but straightforward change. The critical insight is that this shift must apply across the entire project team — not just the builder. Owner advisor / representatives, architects, engineers, and consultants all operate under the same misaligned compensation logic. Changing only the builder contract while leaving the rest of the fee structure intact will produce some improvement – but not to the degree that a financially aligned, systemic, whole-team approach can generate.
Construction is endowed with many talented architects, engineers, managers, and constructors that are making the best of a fragmented and broken system. Thankfully, with modern technology and knowledge resources, the same management philosophy and systems theories that transformed manufacturing is ready to do the same for construction.
Toyota grew from a tiny automaker to world dominance by embracing the philosophy and work of W. Edwards Deming. Until recently, construction’s complexity prohibited the development and implementation of a knowledge system. Today, for lack of a knowledge and data system, the myriads of thousands of transactions between people, processes, and organizations are handled manually.
Deming’s management philosophy requires and enables AEC professionals’ intrinsic motivation to excel to align with their financial motivation to drive out waste. Aligned incentives, combined with Deming’s System of Profound Knowledge, provide the proven solution to reverse construction’s trillion-dollar waste problem.
The Deming System of Profound Knowledge led to the Toyota concept of Autonomation, defined as automation with a human touch or intelligent automation.
Sadly, today every owner advisor, architect, engineer and builder operate in silos – internally and between organizations. Happily, however, any such organization can start their own intelligent automation system transition.
In our next article we will present the five stages to construction’s Intelligent Automation System (IAS) – from early planning and budget to total cost of ownership (TCO).
____________
End Notes:
1 Bureau of Labor Statistics (BLS), "Producer Price Index (PPI) for Construction Inputs and Employment Cost Index (ECI)," U.S. Department of Labor (1970–2026).
2 Ed Zarenski, Construction Inflation 2025 Update (Nov), Construction Analytics, November 13, 2025.