

In this series, we examine the national data showing that today’s buildings cost more than twice what inflation justifies. A simple but stunning calculation reveals why—a reality known by few and likely rejected by all-but-few that do know:
Supporting (including design and management) and indirect costs (general conditions, requirements, allowances, and contingencies), and other overhead costs, and associated profit1 have grown to more than 4× their justifiable cost2.
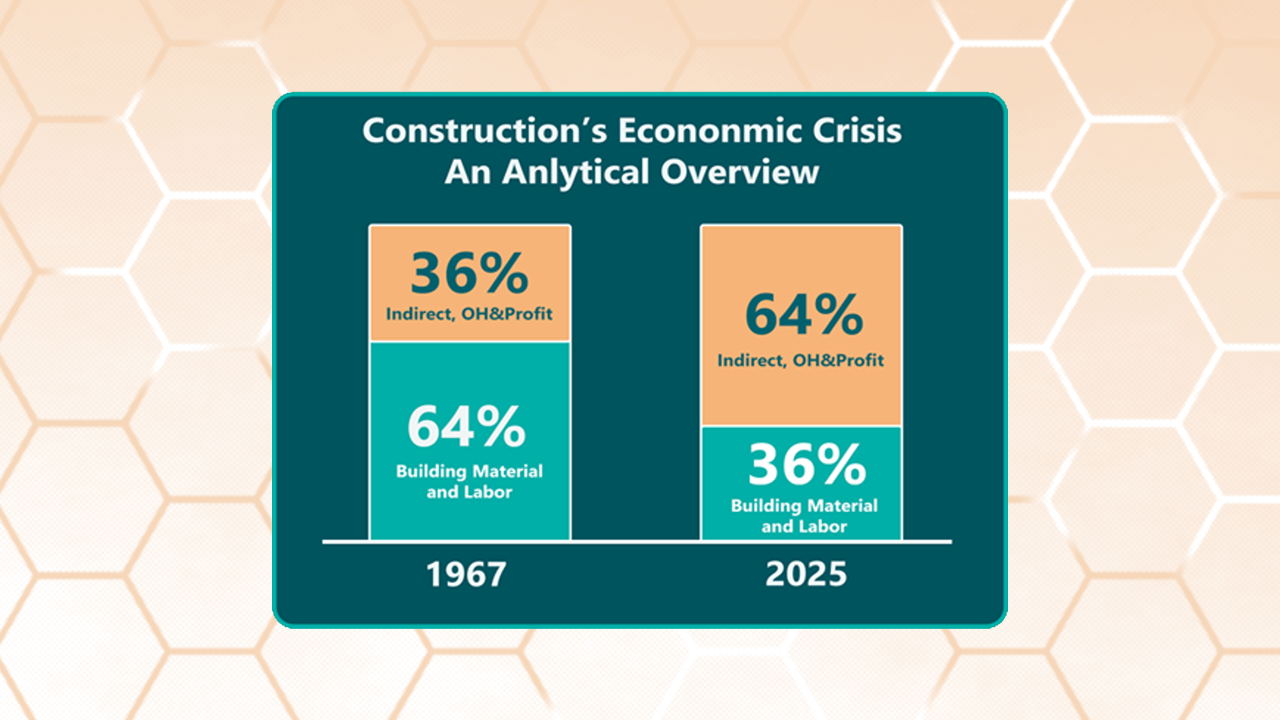
In 1967, therefore, if building materials and direct field labor accounted for 64% of the building cost (including design and management), today these only amount to 36%. Inversely, the indirect costs have grown from 36% to 64% of the project costs.
If true, this revelation should rank as a great historical economic boondoggle – and the reason why one of the two trillion dollars spent on construction is waste.
Nearly all construction industry analysts who are trying to figure the construction costs problem focus on field productivity. This is exactly the wrong focus. The focus must turn to non-field productivity first. It begins in planning, budgeting, programming, and early design—phases that remain shockingly fragmented, archaic, and opaque.
Again, construction’s reform must begin at the beginning—in feasibility and early-stage development—and extend through design and into execution. A true Deming-style reformation - that transformed manufacturing - starts here before addressing field operations; it must span the full project lifecycle, from initial planning through total cost of ownership. But for now, we’ll focus on project development.
First, the data and hypotheses presented in this series will be largely ignored and/or challenged. Further, multi-stakeholder, data research is needed.
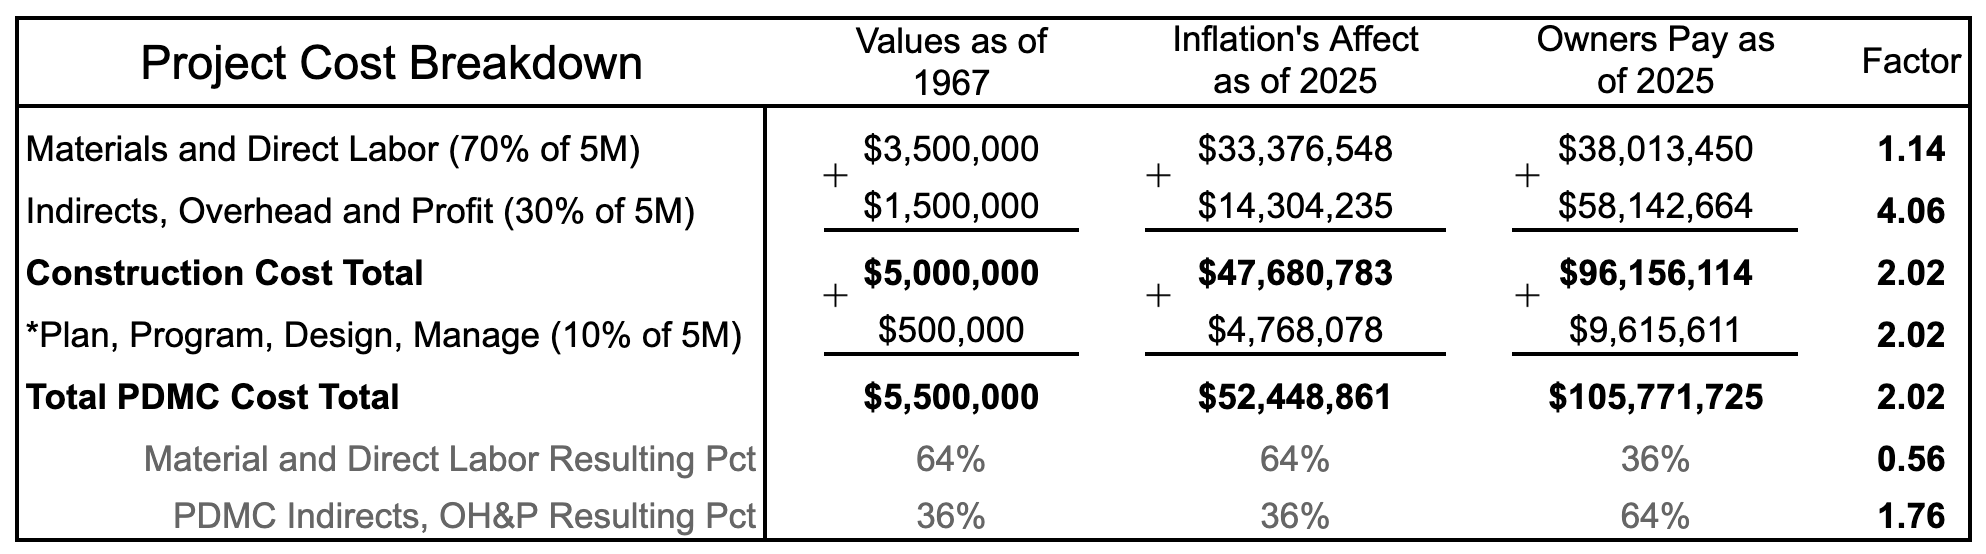
In 1967, the typical hard cost of a project generally broke down as:
Add 10% for planning, programming, design, and owner/rep project management (PDM), and a typical $5M project totaled $5.5M.
Applying escalation data from the Bureau of Labor Statistics through 2025, those costs should now total $52.4M. But owners are paying over $105.7M for the same functional output—a 2.02× overage. The culprit? Indirects, overhead, and profit.
Indirect and OH&P costs have grown from $14.3M (inflation adjusted) to over $58M—a factor of 4.06. Meanwhile, direct material and wages have only grown by a factor of 1.14.
This figure compares a baseline 1967 project at $5M to its 2025 equivalent, based on Department of Commerce escalation data. It highlights the dramatic increase in indirect, overhead, and profit costs—now consuming 64% of total spend, up from just 36%.
The data shows a complete inversion:
We cannot build a high-performance, high-quality, Deming-style field system on top of a broken planning and management structure.
We firmly believe that this massive overhead waste is caused by the profit calculation. For six decades, cost-plus and billable-hour contracting have shifted the financial motivation center of gravity away from cost effectiveness and toward high budgets that help reduce builder risk and increase profit. The system now rewards hours, complexity, and overhead—not outcomes or value.
These data insights present both a threat and an opportunity:
In the next post, we’ll outline how an applied, proven management philosophy—rooted in systems thinking, continuous improvement, and win-win financial structure — can be implemented today, even on current projects.