


Construction costs continue to soar because waste and non-value-added scope continue to skyrocket. The problem won’t end until we can objectively predict market value and hours of effort—and then measure improvement against impartial standards. Like baseball before Moneyball, construction believes it is measuring the right things, but, as you will see, are focused on the wrong metrics..
Moneyball, both the book and the movie, tells how the mid-market Oakland A’s shocked baseball by outsmarting richer teams like the Yankees. General Manager Billy Beane embraced sabermetrics, a data-driven system that revealed traditional scouting was dangerously subjective and built on the wrong measures.
Scouts leaned on gut feel and outdated stats like batting average and stolen bases, which the numbers showed had little correlation to winning. The real predictors—on-base and slugging percentage—had been overlooked because they didn’t fit the old way of thinking. In essence, Beane applied the scientific method—the Deming/Shewhart PDSA cycle—to gain objective knowledge and change the game.
Construction faces the same trap. The industry keeps trying to improve productivity, but with the wrong focus. Prefabrication, and other field productivity strategies, are promoted as the cure—yet national data shows they haven’t solved the problem.
Today, thanks to national macroeconomic data combined with detailed project-level microeconomic data, construction finally has its own version of sabermetrics. And the results are just as disruptive as in baseball.
Figure 1 shows the stunning reality: construction costs are now double their inflation-adjusted value. Why? Because waste and non-value-added scope—indirect, supporting, and overhead costs—have grown to 4.5 times more than necessary.
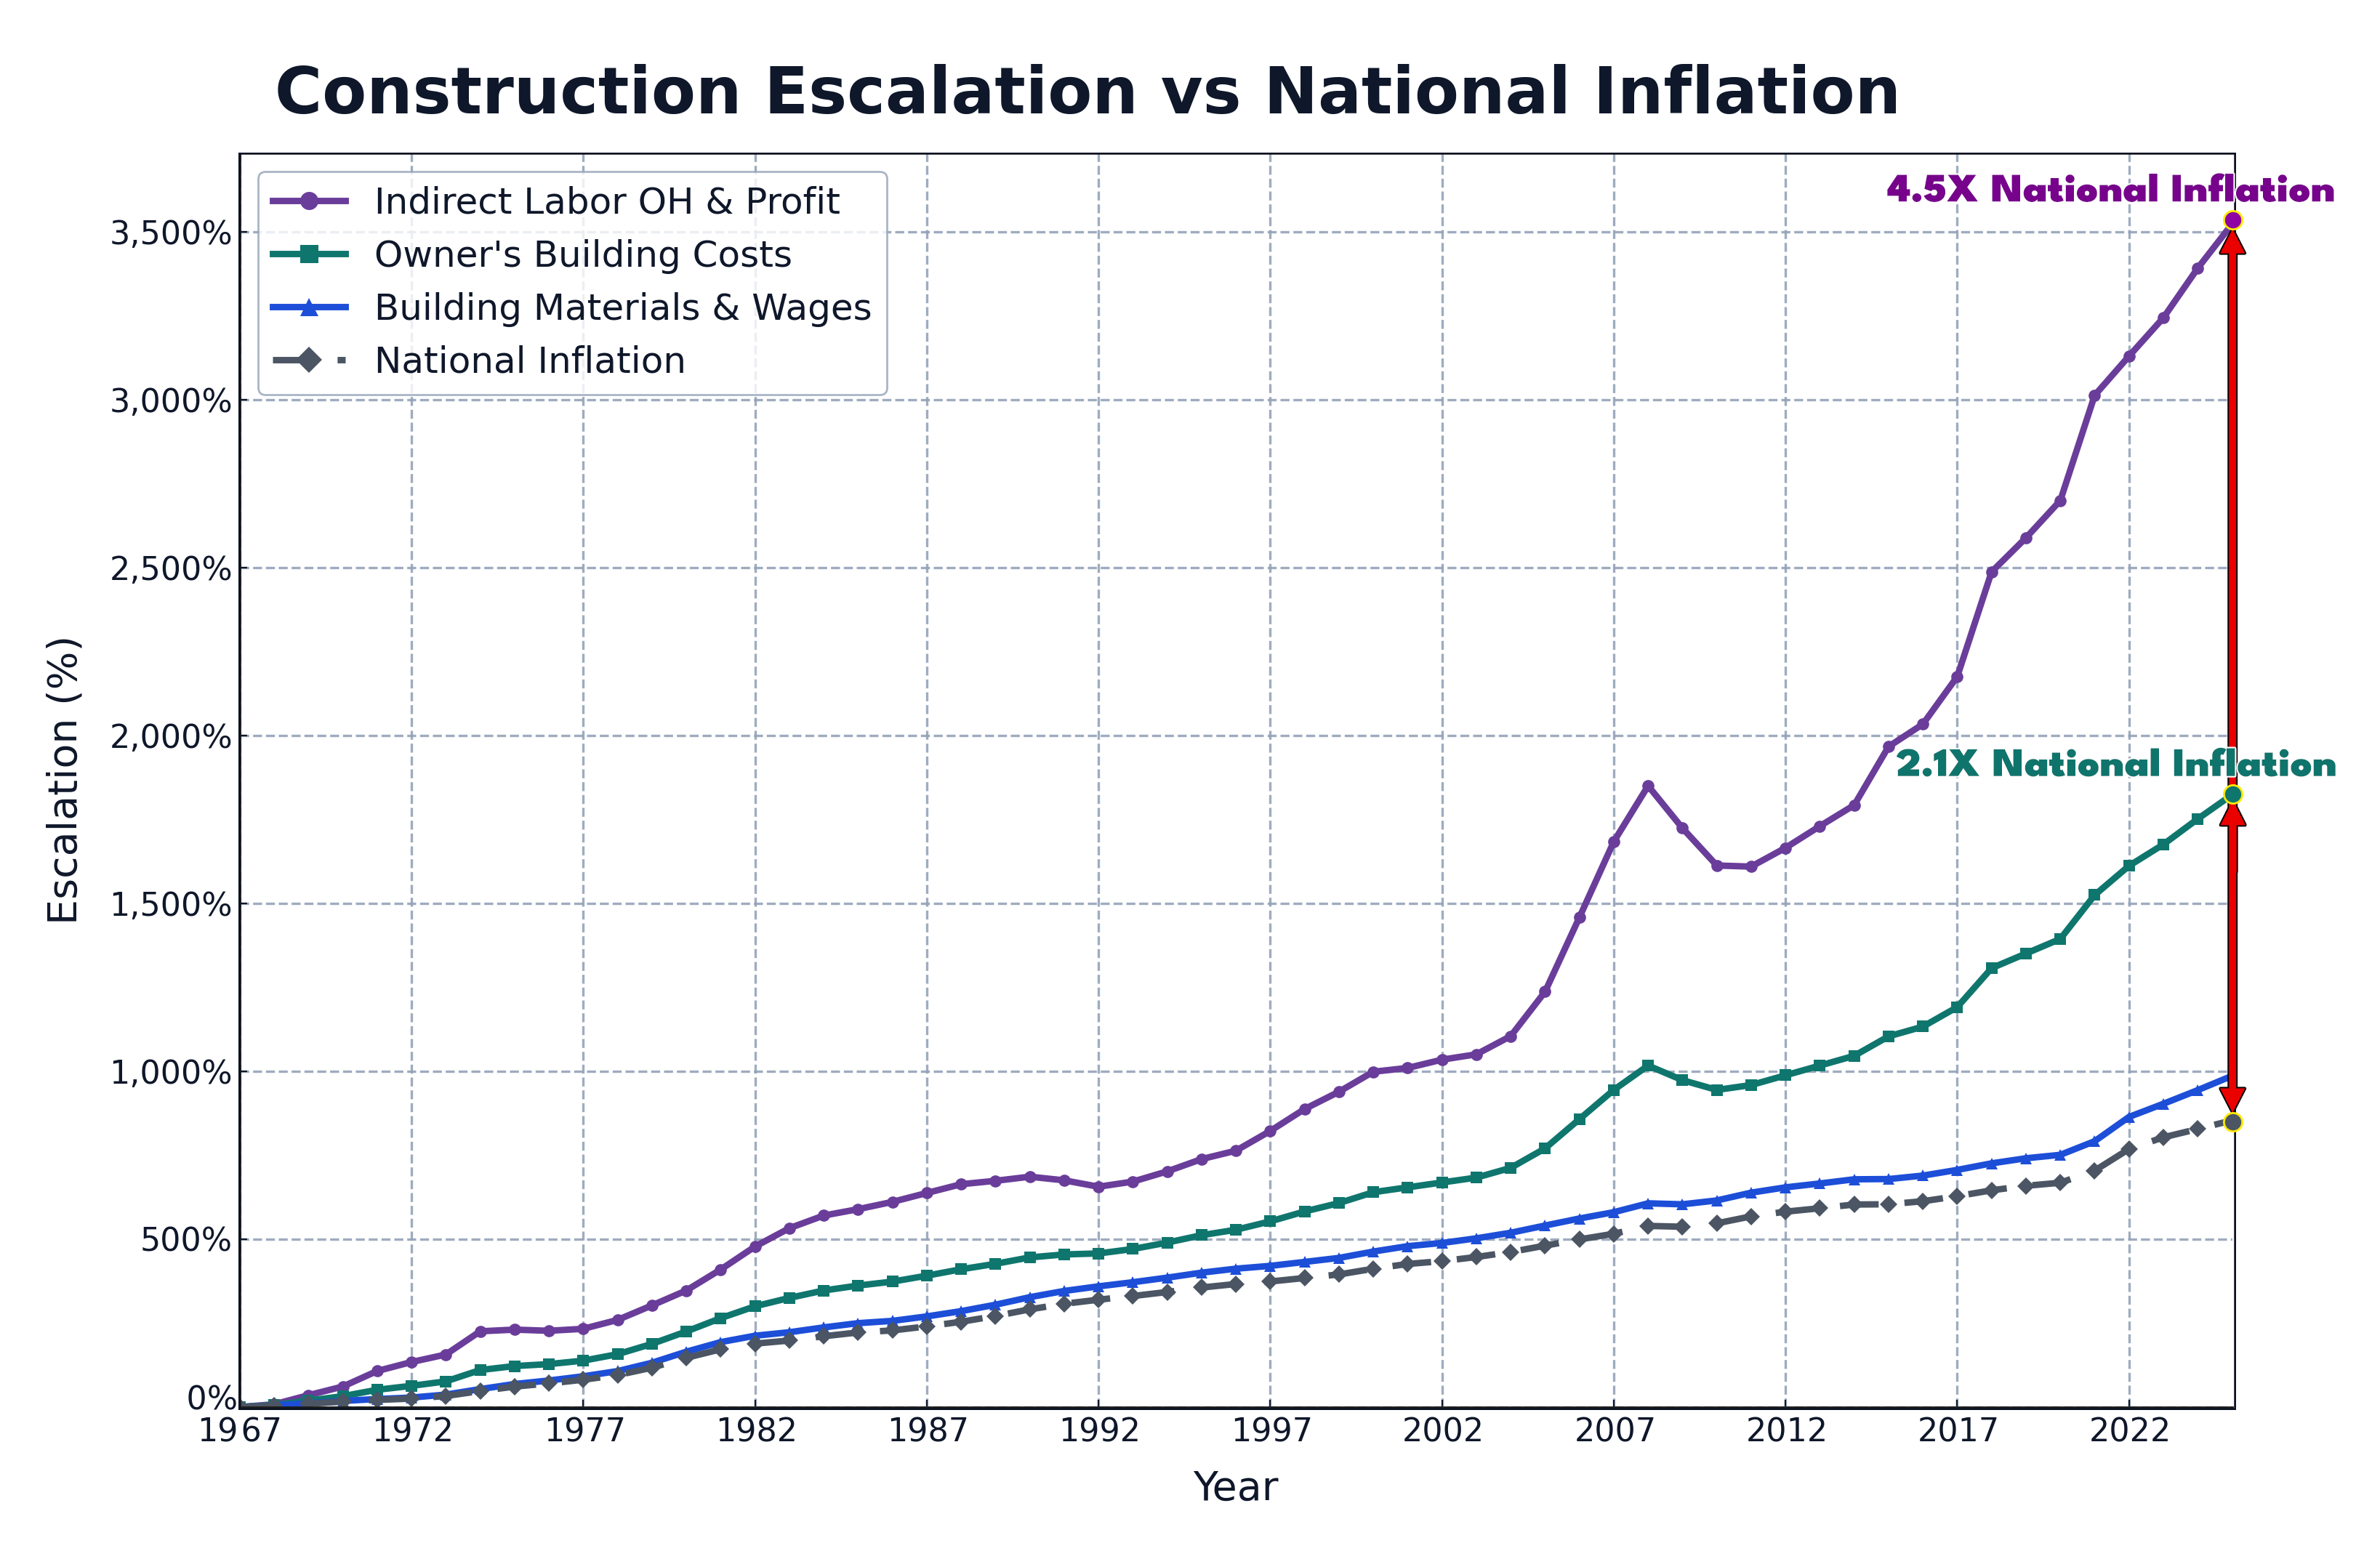
Just as baseball discovered that batting average was the wrong measure, construction is learning that focusing on labor or material costs misses the bigger, hidden driver of escalation: waste in planning, design, and construction services.
This stunning reality has been hidden—or ignored—for decades. Industry attention has fixated on direct labor productivity and material costs, even though these have risen only 14% above inflation.
Prefabrication and other field-level strategies are often promoted as solutions, but the data suggests they have mostly added complexity and cost. Just as baseball wasted years chasing flashy but meaningless stats, construction has been focused on the wrong numbers.
Fortunately, as described in Lean Construction 2.0 – Applied Data Research, we now have the tools to measure what really matters.
The data makes the real lesson clear: we must completely shift our focus. The primary target is not the modest 14% rise in mostly value-added labor and materials, but the 450% growth in wasteful, non-value-added scope.
In baseball terms, we’ve been swinging at the wrong pitch—chasing batting averages when the real game is won by getting on base.
As outlined in The Turning Point – Lean Construction 2.0, the way forward is to integrate existing lean practices with comprehensive strategies for measurable process improvement.
Lean construction draws heavily on the Toyota Production System and lean manufacturing—both rooted in W. Edwards Deming’s management philosophy and systems thinking. Deming stressed that real improvement depends on the measurement of variation, famously declaring:
“If I could reduce my message to management to just a few words, I’d say it all has to do with reducing variation.”
Variation shows up as waste and defects. National data confirms that waste—especially in non-value-added scope—has exploded. And it’s not limited to builder overhead, general conditions, or requirements. It spans the entire chain, from upstream planning and design to downstream trades.
We shouldn’t ignore the more visible problems—defects and rework captured in change orders, inspections, and punch lists. But here’s the point: the same motivation and methods that eliminate non-value-added scope will also address these obvious issues. Solve the bigger problem, and the smaller ones fall in line.
Variation—the gap between predicted and actual outcomes—is the core focus of process improvement. As explored in The Power of Knowledge to Reinvent Construction, the Deming-Shewhart PDSA cycle provides the method: analyze variation, form hypotheses to minimize it, implement changes, then measure again.
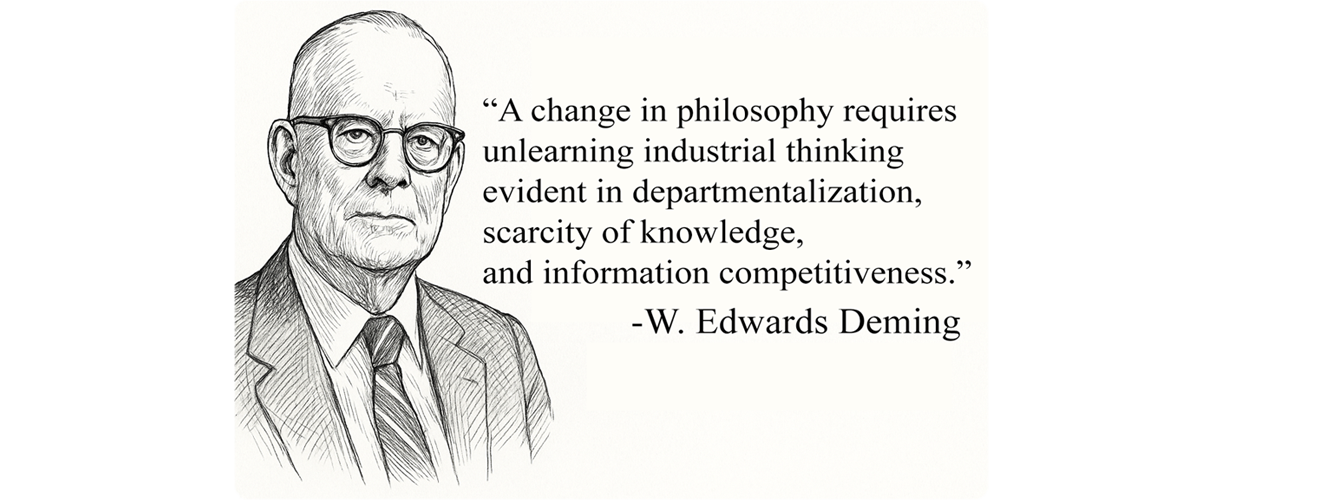
Deming stressed that this requires impartial analysis—something at odds with construction’s NDA-driven, secrecy-based culture. He called for a new philosophy, stating:
As these articles demonstrate, measurable value and process improvement require impartial prediction and analysis—powered by objective knowledge from shared data and transparent information resources.
Today’s planning, design, and construction management processes largely ignore variation measurement. The Last Planner System’s PPC (Percent Plan Complete) and pull planning methods are rare exceptions. But even these fall short: without impartial prediction and analysis, their impact remains limited. Their effectiveness will grow dramatically once Deming’s approach to variation measurement based on impartial analysis is incorporated.
Toyota transformed automotive design and production by applying Deming’s philosophy and systems approach. Building CATALYST applies the same philosophy and approach to transform building planning, design, and construction.
While industry-wide standards are still needed, CATALYST has already applied data science and impartial analysis across hundreds of real projects. The results prove that measurable value and process improvement are achievable across many building types. Given the scale of variation (accumulated waste) in the industry, the implications are enormous—there’s no reason to wait to address the primary sources of risk, waste, and defects.
By starting with the top layer of waste and working downward, we can now predict the inflated market average and range for total construction costs. This prediction comes from national macroeconomic data plus microeconomic data analysis. More than 700 projects have been modeled at the whole-building level, with 145 projects examined through detailed PDSA cycles to measure variation—predicted versus actual—across each function, key control quantity, and Uniformat Level 3 cost. Thousands of iterations of this cycle enable the most accurate, impartial analysis of construction market valuation ever achieved. This resulting objective knowledge acquisition process will only be enhanced with the growing AI movement.
With impartial, market-based building valuation now available, four actionable areas of measurable value improvement can begin today:
These benefits can be experienced today, setting the stage to remove deeper layers of waste in time and cost through measurable improvement across design, procurement, and construction.
Need inspiration? Rewatch Moneyball—a reminder of how data and analytics can expose the truth and change an entire industry. Construction is ready for its own Moneyball moment.
👉 Visit www.buildingcatalyst.com to learn more or get started.