

Exaggeration for the sake of emphasis is disingenuous and defeats the intended purpose. The claims and hypotheses presented here are serious enough to warrant scrutiny and controversy without overstating them.
Based on the analysis of data from multiple sources1,2,3, a billion-dollar hospital project currently under construction will contain about $700 - $850 million in non-value-added (NVA) consulting, design, supporting/indirect labor, waste (rework), insurance, permits, services, overhead, and profit. That only leaves about $150 - $300 million in actual work: building materials, equipment, and direct labor.
Credible data analytics shows that, on average, non-value-added scope had grown in 2025 to more than four times what national inflation would justify. Extending that analysis to a more recent 35-hospital research initiative, non-value-added scope has increased more than sixfold in Middle America,1,3 and significantly more than that in California.
Modern data capabilities now make it possible to collect, normalize, and compare actual project costs across many projects. These controversial findings can therefore be tested, challenged, refined, or proven wrong, while those same capabilities can provide the objective knowledge system needed for construction reform.
In A Solvable Hospital Cost Crisis, it is argued that misaligned incentives are the main problem, and that this problem must and now can be solved. Cost-plus and billable-hour compensation frameworks sit at the center. Unless they are replaced with a value-based framework, the crisis deepens and construction remains in a severely stagnated state..
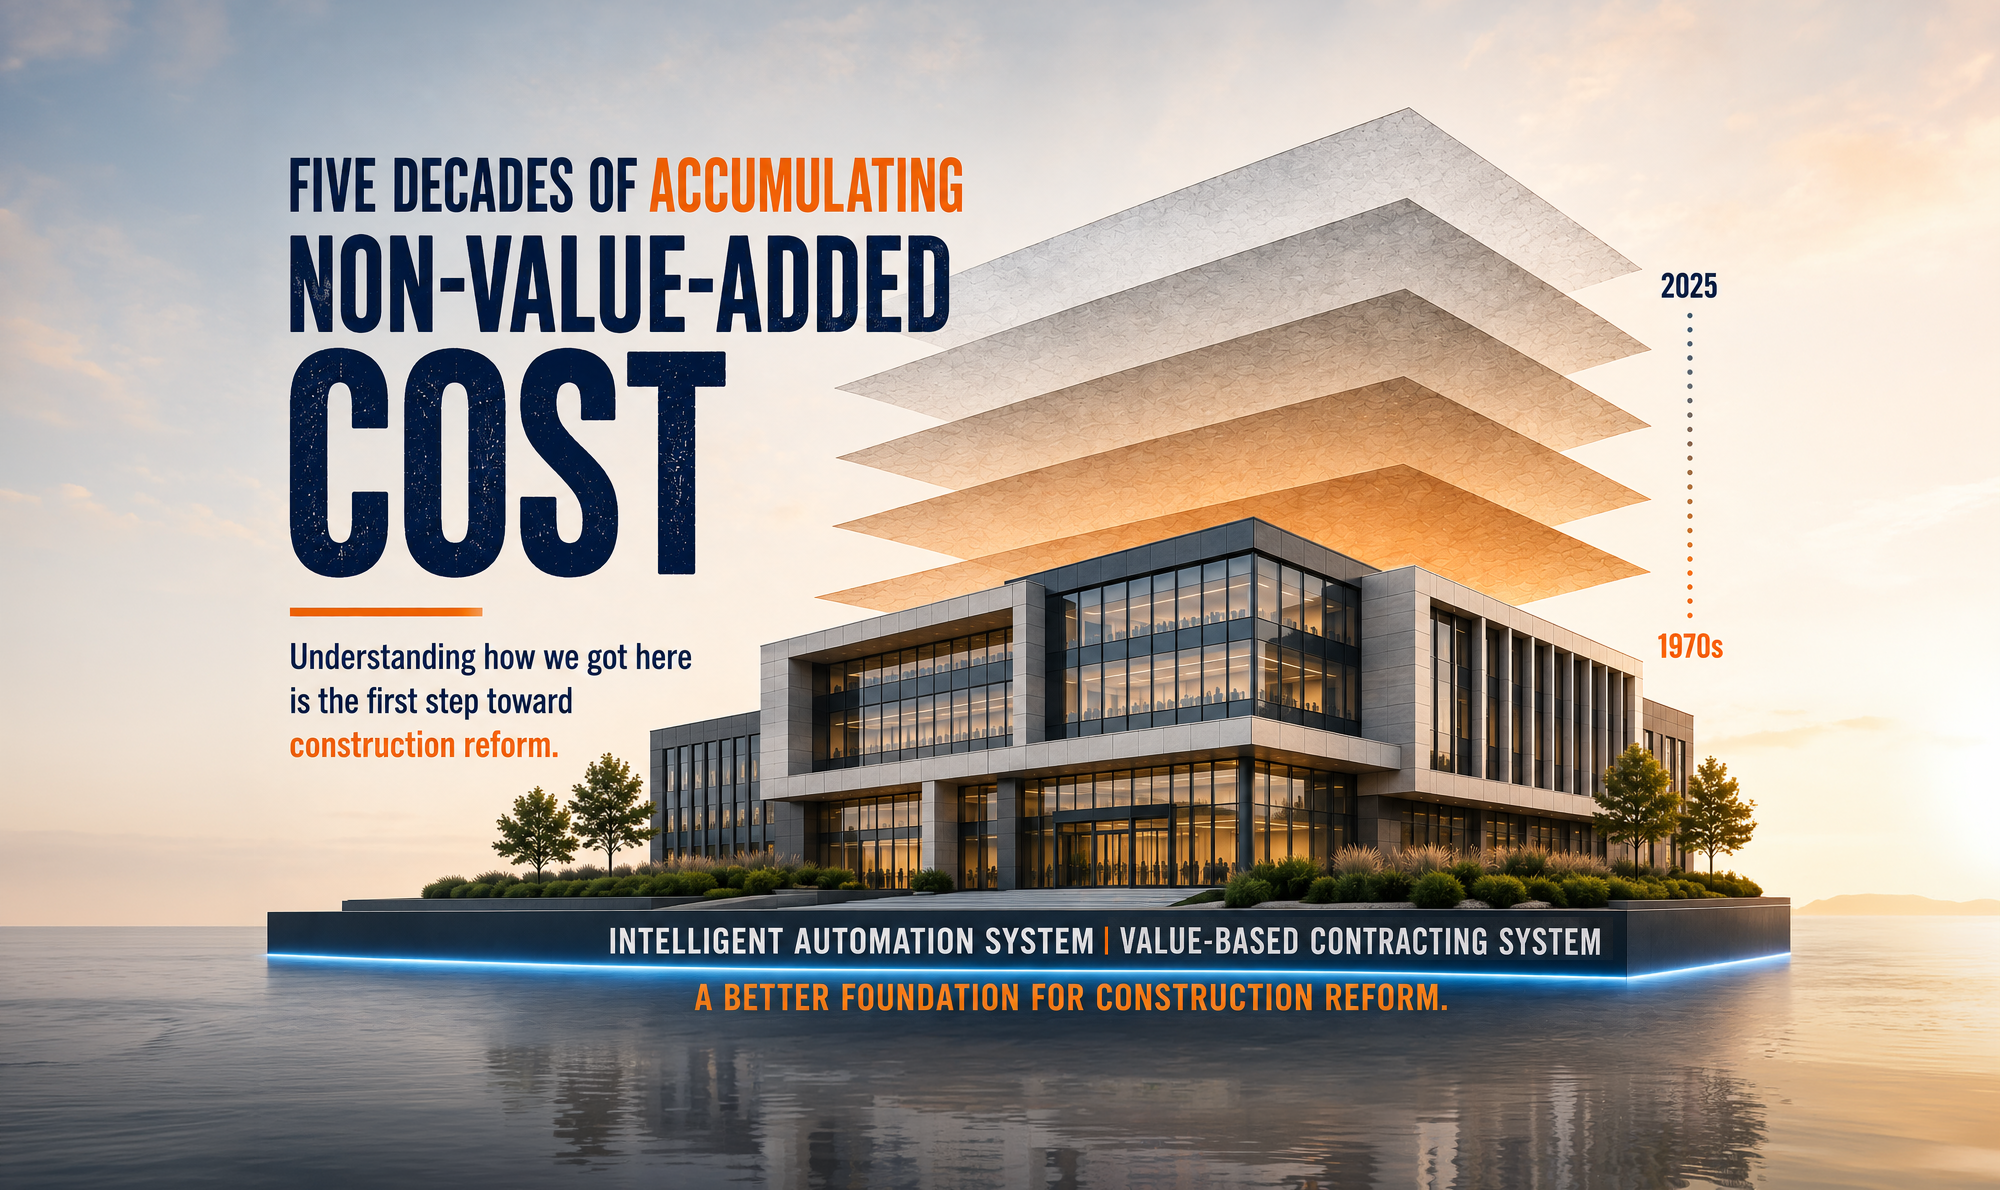
That problem began over fifty years ago and has grown to a scale that now warrants a construction reform movement. That required delving deeper into that history, because understanding how we got here is what makes the case for reform impossible to deny.
The following reflects the author's experience and data observations presented throughout this series of articles.
The CM (Construction Management) delivery method was introduced in the 1970’s to help solve the problem of building projects coming in over budget and behind schedule. High inflation was part of the problem.
Bringing the builder, termed the CM, into the design process early was supposed to give the owner access to the builder's expertise: more accurate cost and schedule predictions, help with design decisions, and constructability reviews. It also allowed design and bidding to be phased, delivering the project much sooner. Taken together, these changes were meant to address construction's stagnation problem by making projects run more efficiently and more cost effectively.
The results were unsatisfactory. As a result, numerous innovations emerged, including TQM, Partnering, LEED, Design-Build, BIM, Lean, IPD, and VDC.
Over the past five decades, some qualitative survey data⁴ shows that more projects are coming in "on time" and "under budget." But the hard cost data shows that owners and taxpayers are paying an extraordinary premium to buy those two phrases.
There is a fundamental problem that existed in the 1970s and is far more serious today, yet remains largely unrecognized or ignored.
No builder or cost consultant has developed a reliable means of collecting and using real world cause-and-effect data that is essential to predicting future project outcomes.
This becomes especially important when an owner or lender requires a guaranteed maximum price (GMP) before the trade work has been fully bid. The owner is therefore relying on the builder to establish a maximum cost before the actual market value is known. That requirement transfers the risk of uncertainty to the builder, even though the builder lacks the data, tools, and predictive capability needed to reliably know what the project will ultimately cost.
This cycle has fueled a spiraling effect as many hospitals have now surpassed the billion dollar milestone and as others are chasing after two and even three billion dollar extremes.
Historically, planners, designers, consultants, builders, subcontractors, and suppliers - generate their overhead and profit based on the cost of the work and/or their effort in terms of hours. There’s no financial benefit to reduce cost or billable hours when the budget is set high enough. This has caused today's extraordinary and unsustainable cost problems, especially on complex projects.
In the early days of CM, the construction services fee (overhead and profit) was almost exclusively generated by the exposed modest/competitive fee structure in the 1.5 to 4 percent range. The cost of the work included the CM’s staff and equipment that was billed at cost. This practice was the same in their lump sum competitive bid projects. Only payroll taxes, benefits and insurance were added to the direct project staff and field labor.
Since then, several layers of non value added (NVA) scope have become embedded throughout supplier, trade contractor, builder, designer, and consultant contracts. As a result, the stated percentages for design fees, construction services, or general conditions may not appear alarming on their own, while the underlying cost base has grown substantially and NVA scope has spread throughout the project. This helps explain how three seemingly conflicting realities can all be true at the same time on hospital projects:
There are at least twelve compounding NVA layers that have evolved over the decades that have caused NVA costs to spiral out of control. Although these layers deserve a more extensive explanation, let’s start with this overview:
The bad news is that It would be humanly impossible to unravel, remove or reverse most of these NVA scope and cost layers.
The good news is, we don't have to. A construction reform alternative is now possible, replacing both our fragmented delivery structure with a system and our misaligned incentives with value-based compensation..
When participants prosper by reducing total cost, eliminating waste, and improving outcomes rather than increasing cost, scope, or hours, the incentives that created and sustain these twelve NVA problems fundamentally change. Instead of attacking each problem individually, the system begins to remove the conditions that allow them to persist. In that sense, the twelve NVA problems largely begin to take care of themselves.
These two articles, Construction Reform Requires Profound Knowledge, and The Case for Construction as a System, present a methodical, ready to adopt and implement, road map for reform. Many projects currently in planning or early design can try out and start reaping the benefits in a matter of weeks.
When ready to try out, take next steps, or learn more, please visit www.buildingcatalyst.com.
End notes:
1 Building CATALYST - Applying MVA (multivariate analysis) in March and April 2026 - CATALYST performed micro-economic analysis of 35 hospital projects, spanned multiple regions, owners, designers and builders, with project data anonymized for confidentiality.
2 Bureau of Labor Statistics (BLS), "Producer Price Index (PPI) for Construction Inputs and Employment Cost Index (ECI)," U.S. Department of Labor (1970–2026).
3 Ed Zarenski, Construction Inflation 2025 Update (Nov), Construction Analytics, November 13, 2025.
4 Lean Construction Institute - LCI Research Papers